
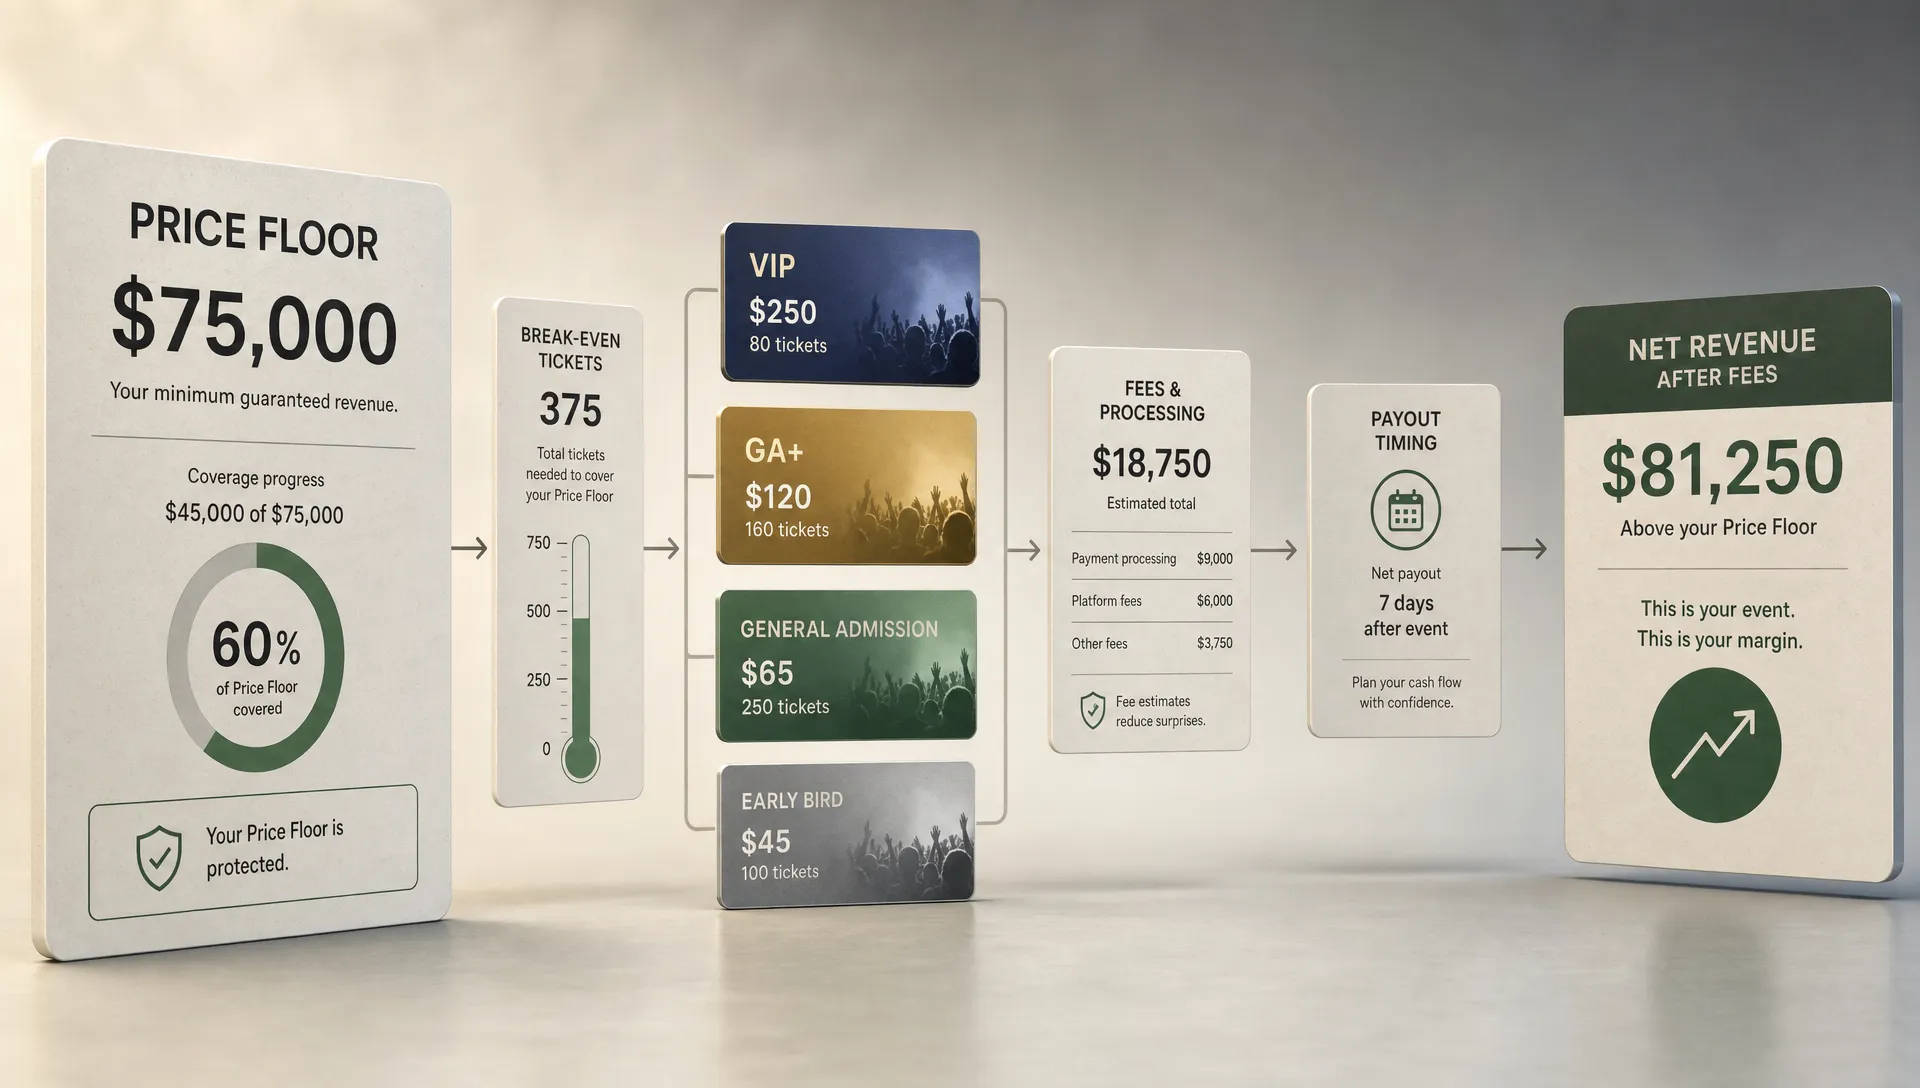
Build an Event Ticket Price Calculator That Protects Profit
A profitable event is rarely protected by a good guess. It is protected by a clear price floor, realistic attendance assumptions, and a calculator that shows what happens when fees, comps, discounts, and slow sales start eating into the plan.
An event ticket price calculator should do more than divide your budget by capacity. For organizers, music producers, and event teams managing tight cash flow, it should answer five practical questions before tickets go live:
- What is the minimum ticket price that keeps the event out of the red?
- How many paid tickets do you need to break even?
- How much profit remains after ticketing fees, payment processing, and discounts?
- Which ticket tiers can create urgency without underpricing the room?
- When will enough cash arrive to cover deposits, artists, staff, and venue costs?
The goal is not to make your spreadsheet complicated. The goal is to make your pricing decisions harder to fool.
Start with net revenue, not gross sales
Many event budgets look healthy because they focus on gross ticket revenue. If you sell 200 tickets at $40, the gross number is $8,000. That sounds simple, but it is not the amount you keep.
Before profit appears, you may need to subtract venue rental, talent guarantees, production, marketing, staff, insurance, ticketing costs, payment processing, refunds, taxes, and complimentary tickets. If you also absorb buyer fees, the difference between gross and net revenue can be large enough to turn a “sold well” event into a thin-margin night.
This is why your calculator should be built around net revenue per ticket. If you want a deeper strategic view beyond the calculator itself, TixFlow’s guide to event ticket pricing strategies that protect margins is a useful companion. The calculator gives you the math; the strategy tells you how to use the math with your audience.
Gather the inputs before you build formulas
A ticket price calculator is only as accurate as the assumptions behind it. Before you create formulas, collect the numbers that determine whether each ticket sold actually moves you closer to profit.
| Input | What to include | Why it matters |
|---|---|---|
| Fixed costs | Venue, talent, production, equipment, insurance, design, marketing, permits | These costs exist whether you sell 50 tickets or sell out |
| Variable cost per attendee | Wristbands, check-in costs, drink tickets, staffing tied to attendance, per-guest supplies | These rise as attendance rises |
| Capacity | Legal or practical room capacity | This caps your possible paid sales |
| Comps and holdbacks | Guest list, artist allocation, sponsor tickets, media, staff tickets | These reduce sellable inventory |
| Paid ticket target | Conservative expected paid attendance | Pricing at full capacity can create false confidence |
| Platform fee per ticket | Your ticketing platform’s per-ticket cost | Flat fees are easier to model than complex percentage fees |
| Payment processing | Card processing percentage and fixed transaction fee | Check your provider’s current rates, such as the rates listed on Stripe’s pricing page |
| Taxes you absorb | Sales tax, VAT, amusement tax, or local charges if included in the displayed price | If you collect tax on top, do not treat it as revenue |
| Refund or contingency buffer | A small reserve for refunds, delays, damaged equipment, or last-minute costs | Protects profit when the event changes |
| Target profit | The amount you want left after all costs | Turns the calculator into a decision tool, not just a break-even sheet |
For cash-sensitive events, be conservative with attendance. If the room holds 300 but your likely paid turnout is 220 after comps and realistic demand, build the first version around 220. A calculator that only works at maximum capacity is not protecting profit. It is documenting a best-case scenario.
Build the core event ticket price calculator
You can build the calculator in Google Sheets, Excel, Airtable, or any finance tool your team already uses. The structure is simple: one tab for assumptions, one tab for ticket tiers, one tab for cash flow, and one tab for scenarios.
At the center of the calculator are three formulas.
Formula 1: sellable paid tickets
Sellable paid tickets = capacity - comps - holdbacks
This gives you the upper limit of paid inventory. It is not your sales forecast. It is the number of tickets you could sell if demand is strong.
Then add a separate input for expected paid tickets:
Expected paid tickets = your realistic sales forecast
For example, a 250-capacity venue with 20 comps has 230 sellable paid tickets. But if you expect to sell 200, your price floor should be built around 200, not 230.
Formula 2: net per ticket
Net per ticket = ticket price - flat per-ticket costs - variable attendee costs - percentage fees absorbed
A more spreadsheet-friendly version looks like this:
Net per ticket = ticket price × (1 - percentage fees absorbed) - fixed per-ticket costs
In this formula, “percentage fees absorbed” can include card processing percentage, taxes included in the ticket price, or any other percentage-based cost you pay out of the ticket price. “Fixed per-ticket costs” can include platform fees, fixed processor charges, check-in supplies, and any other cost that rises with each paid attendee.
Formula 3: required average ticket price
This is the most important formula in the calculator because it tells you the average ticket price needed to hit your target profit.
Required average ticket price = (fixed costs + contingency buffer + target profit + expected paid tickets × fixed per-ticket costs) ÷ (expected paid tickets × (1 - percentage fees absorbed))
This formula gives you a required average price, not necessarily one public ticket price. You can reach that average through early-bird tickets, general admission, VIP tiers, late pricing, or door pricing.
| Calculator output | Formula | What it tells you |
|---|---|---|
| Sellable paid tickets | Capacity - comps - holdbacks | Your maximum paid inventory |
| Required average price | Costs, target profit, ticket count, and absorbed percentage fees | The average gross ticket price you need |
| Forecast profit | Expected paid tickets × net per ticket - fixed costs - contingency | Whether your plan protects profit |
| Break-even paid tickets | Fixed costs ÷ average net contribution per ticket | How many tickets you need before profit begins |
| Safe discount limit | Listed price - required price floor | How much you can discount without losing margin |
Example: pricing a 200-ticket music event
Imagine you are producing a small music event with a practical target of 200 paid attendees. Your venue can hold more, but after comps, uncertainty, and realistic demand, 200 is the number you trust.
| Cost item | Amount |
|---|---|
| Venue | $1,200 |
| Artists and producer costs | $1,500 |
| Staff and security | $600 |
| Production and AV | $500 |
| Marketing | $350 |
| Insurance and permits | $150 |
| Total fixed costs | $4,300 |
Now add these assumptions:
| Assumption | Amount |
|---|---|
| Expected paid tickets | 200 |
| Target profit | $1,500 |
| Contingency buffer | $400 |
| Fixed per-ticket costs | $3.30 |
| Percentage fees absorbed | 2.9% |
The required average ticket price would be:
($4,300 + $400 + $1,500 + 200 × $3.30) ÷ (200 × (1 - 0.029)) = $35.32
That means your event needs an average ticket price of about $35.32 to hit the target profit under these assumptions. You would likely round above that number, not below it, because real events rarely follow the spreadsheet perfectly.
A $36 average price would barely protect the target. A $39 average price creates more breathing room.
Use tiers to reach the target average
Most events should not rely on a single ticket price. Tiering gives you flexibility. It lets price-sensitive buyers act early, while later buyers pay closer to the event date when urgency and confidence are higher.
Here is a simple tier model for the same event:
| Ticket tier | Quantity | Price | Gross revenue |
|---|---|---|---|
| Early bird | 50 | $29 | $1,450 |
| General admission | 100 | $39 | $3,900 |
| Final release | 50 | $49 | $2,450 |
| Total | 200 | Average $39 | $7,800 |
With an average gross ticket price of $39, this tier structure clears the $35.32 required average and creates a profit buffer. Using the assumptions above, the forecast profit after fixed costs, per-ticket costs, absorbed percentage fees, and contingency is approximately $2,213.80.
That does not mean every event should use these exact tiers. It means the calculator can show whether your tiers are doing their job. If early-bird tickets are too cheap or too plentiful, they can pull the average below your price floor. If final-release tickets are too high for your audience, sales may stall before the event reaches break-even.
This is where ticketing operations matter. On TixFlow, organizers can use unlimited ticket tiers, automated sales phases, smart promo codes, and real-time sales control to make pricing easier to manage after the plan is set. If you are still deciding how to structure those offers, this guide on choosing the right type of ticket for any event can help you match ticket types to buyer behavior.
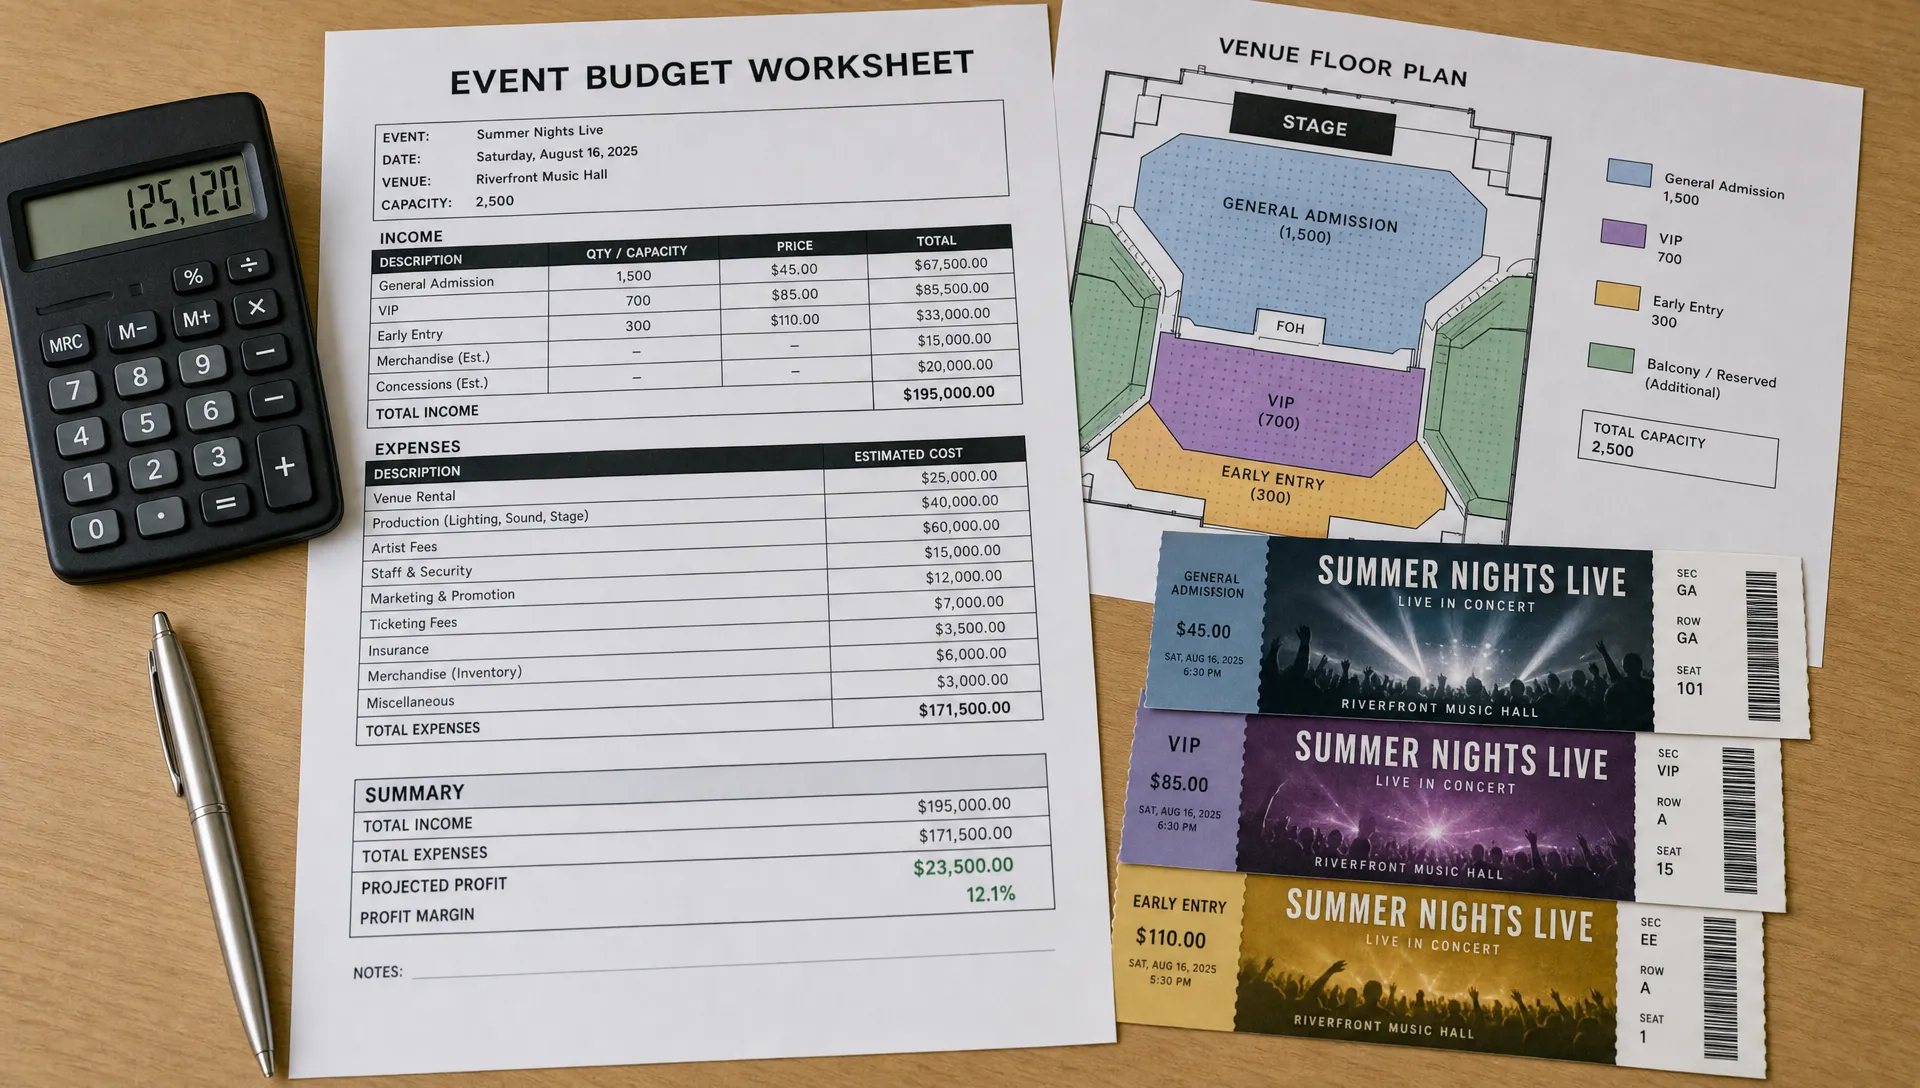
Decide whether to absorb or pass on fees
Fee strategy has a direct impact on your calculator. If you absorb ticketing and processing fees, your displayed ticket price may look cleaner to buyers, but your net revenue per ticket falls. If you pass fees to buyers, your margins are easier to protect, but the checkout total is higher.
There is no universal answer. The right choice depends on your audience, ticket price, event type, and market expectations. A $3 fee may feel different on a $15 community event than it does on a $95 festival pass.
Your calculator should include a simple fee toggle:
| Fee approach | Calculator impact | Best used when |
|---|---|---|
| Organizer absorbs fees | Fees reduce net revenue per ticket | You want a cleaner advertised price and can price high enough to protect margin |
| Buyer pays fees | Face-value ticket revenue is easier to preserve | Your audience expects checkout fees or your margin is tight |
| Hybrid approach | Some fees are built into price and some are passed through | You want a balanced checkout experience without absorbing everything |
If absorbing fees has become your default, it is worth testing the impact before the next launch. TixFlow has a dedicated breakdown on why organizers should stop absorbing ticket fees when doing so quietly cuts into event revenue.
Add a discount safety check
Promo codes can help sell tickets, reward partners, and create urgency. They can also destroy margin if they are not tied to a price floor.
Add this formula to your calculator:
Maximum safe discount = listed ticket price - required minimum ticket price
For example, if your general admission ticket is $39 and your required average price floor is $35.32, a $5 discount may be too aggressive unless other tickets make up the difference. A $3 discount might be safer, especially if it is limited to a small quantity.
The calculator should track discounts in two ways. First, track the discount amount per ticket. Second, track the quantity of tickets that can use the code. A small discount used by 20 people may be harmless. The same discount used by 150 people can move the entire event below the required average.
A good promo code tab should include:
| Promo field | Why it matters |
|---|---|
| Code name | Helps identify the partner, campaign, or audience segment |
| Discount amount or percentage | Shows direct revenue impact |
| Usage cap | Prevents the discount from spreading too far |
| Valid ticket tier | Keeps discounts away from already-low tiers |
| Expiration date | Creates urgency and limits margin exposure |
| Forecast revenue impact | Shows whether the code still protects profit |
Smart promo codes are useful only when the numbers behind them are disciplined. The calculator should make it obvious when a code helps sales and when it simply gives away profit.
Build a cash flow tab, not just a profit tab
Profit and cash flow are related, but they are not the same. An event can be profitable on paper and still create stress if deposits are due before ticket revenue lands.
Your cash flow tab should track when money leaves and when money arrives. For music producers and independent organizers, this can be the difference between a controlled launch and a last-minute scramble.
Use a simple timeline:
| Date | Cash movement | Amount | Notes |
|---|---|---|---|
| 8 weeks out | Venue deposit | -$600 | Due before ticket launch |
| 6 weeks out | Marketing spend | -$250 | Ads and creative |
| 4 weeks out | Artist deposit | -$750 | Contracted guarantee |
| Launch onward | Ticket revenue | Varies | Depends on payout timing |
| Event week | Staff and production balance | -$1,100 | Final operational costs |
| Event night | Door sales or final release | Varies | Do not rely on this to cover earlier deposits |
Then add a cash gap formula:
Cash gap = deposits and costs due before payouts - available cash - settled ticket revenue
This is where payout timing matters. TixFlow is built with instant payouts, which can help organizers keep cash moving instead of waiting until long after the event. Your calculator should still model timing conservatively, especially for first-time events, new venues, or high upfront production costs.
Stress test the event before tickets go live
A calculator is most valuable when it shows what happens if the plan changes. Build at least three scenarios: conservative, expected, and strong.
Using the same event assumptions, your scenario tab might look like this:
| Scenario | Paid tickets | Average ticket price | Forecast profit after contingency | What it tells you |
|---|---|---|---|---|
| Conservative | 160 | $36.50 | $442.64 | The event survives, but misses the profit target |
| Expected | 200 | $39.00 | $2,213.80 | The event clears the target with buffer |
| Strong | 225 | $41.00 | $3,514.97 | Demand supports higher late-stage pricing |
The conservative scenario is often the most useful. If it shows a loss, you have options before launch: reduce fixed costs, cut comps, raise the final-release price, find a sponsor, reduce discount quantities, or choose a smaller venue.
Do not wait until sales slow down to look at this. Build the stress test before the first ticket is sold.
Update the calculator after launch
Your calculator should not sit untouched once tickets are live. Real sales data will show whether your pricing assumptions were accurate.
Track these signals every few days during the campaign:
| Signal | What to watch | Possible action |
|---|---|---|
| Sales velocity | Tickets sold per day or per week | Move to the next tier sooner, increase promotion, or adjust capacity plans |
| Tier conversion | Which ticket types are selling fastest | Add inventory to strong tiers or retire weak ones |
| Promo code usage | Which codes are driving sales | Expand productive codes and stop margin-draining ones |
| Average ticket price | Actual average compared with required average | Raise later tiers if the average is falling too low |
| Break-even progress | Tickets sold compared with break-even count | Control spending until the event crosses break-even |
If your platform gives you real-time sales control, use it. Pricing is not a one-time decision. It is a live operating system for revenue. For a deeper look at which numbers to monitor, TixFlow’s guide on using ticket statistics to improve event sales explains how sales data can guide better pricing and promotion decisions.
Common calculator mistakes that hurt profit
The math does not need to be advanced, but a few mistakes can make the output misleading.
Pricing from full capacity instead of realistic paid attendance. If the room holds 300 but you are likely to sell 210, pricing from 300 creates a false break-even point.
Forgetting comps. Guest list tickets are normal, especially for music events, sponsors, press, and collaborators. But every comp reduces paid inventory.
Ignoring fixed payment fees. Percentage fees are easy to remember. Fixed transaction charges are easy to forget, especially on lower-priced tickets.
Letting early-bird tickets dominate the mix. Early pricing should create momentum, not train the audience to wait for discounts.
Treating tax as revenue. If tax is collected and remitted, it should not inflate your revenue forecast.
Failing to model payout timing. Profit after the event does not solve a cash shortage before the event.
A simple calculator structure you can copy
If you are building your own spreadsheet, start with four tabs.
| Tab | Purpose | Key fields |
|---|---|---|
| Assumptions | Stores the core inputs | Capacity, comps, costs, fees, target profit, contingency |
| Ticket tiers | Models pricing and inventory | Tier name, quantity, price, sales phase, gross revenue |
| Promo codes | Controls discount impact | Code, discount, usage cap, valid tier, revenue impact |
| Cash flow | Tracks money in and out | Deposit dates, payout timing, expenses, cash gap |
Once those tabs are working, add scenarios. A useful calculator does not need to predict everything perfectly. It needs to show you which decisions protect profit and which ones create unnecessary risk.
Frequently Asked Questions
What is an event ticket price calculator? An event ticket price calculator is a spreadsheet or tool that helps organizers estimate ticket prices, break-even points, profit, fees, discounts, and cash flow before tickets go on sale.
How do I calculate the break-even ticket price for an event? Add fixed costs, contingency, expected per-ticket costs, and any absorbed percentage fees. Then divide the required revenue by realistic paid attendance, not maximum venue capacity.
Should I price tickets based on capacity or expected attendance? Use expected paid attendance for your main price floor. Capacity is useful for upside planning, but expected attendance gives you a safer and more realistic profit forecast.
How should I include complimentary tickets in the calculator? Subtract comps and holdbacks from total capacity before calculating sellable inventory. Comps should also be reviewed carefully because they reduce the number of paid tickets available.
Can I use the calculator for concerts, club nights, workshops, and small events? Yes. The same structure works for most ticketed events. You may change the cost categories, ticket tiers, and cash flow timing, but the core pricing logic stays the same.
How often should I update the calculator after launch? Update it whenever sales volume, promo code usage, costs, or ticket inventory changes. For fast-moving events, reviewing the calculator several times per week can help prevent margin surprises.
Turn pricing math into cleaner ticket sales
A strong event ticket price calculator gives you control before the pressure starts. It shows the price floor, protects discounts from going too far, and helps you understand when the event becomes profitable.
The next step is using a ticketing setup that supports the plan. With TixFlow, organizers can sell tickets through customizable event pages, use unlimited ticket tiers, automate sales phases, manage digital guest lists, control sales in real time, and keep cash flow moving with instant payouts. If you want pricing decisions to stay connected to the way tickets are actually sold, explore the modern event ticketing tools at TixFlow.