
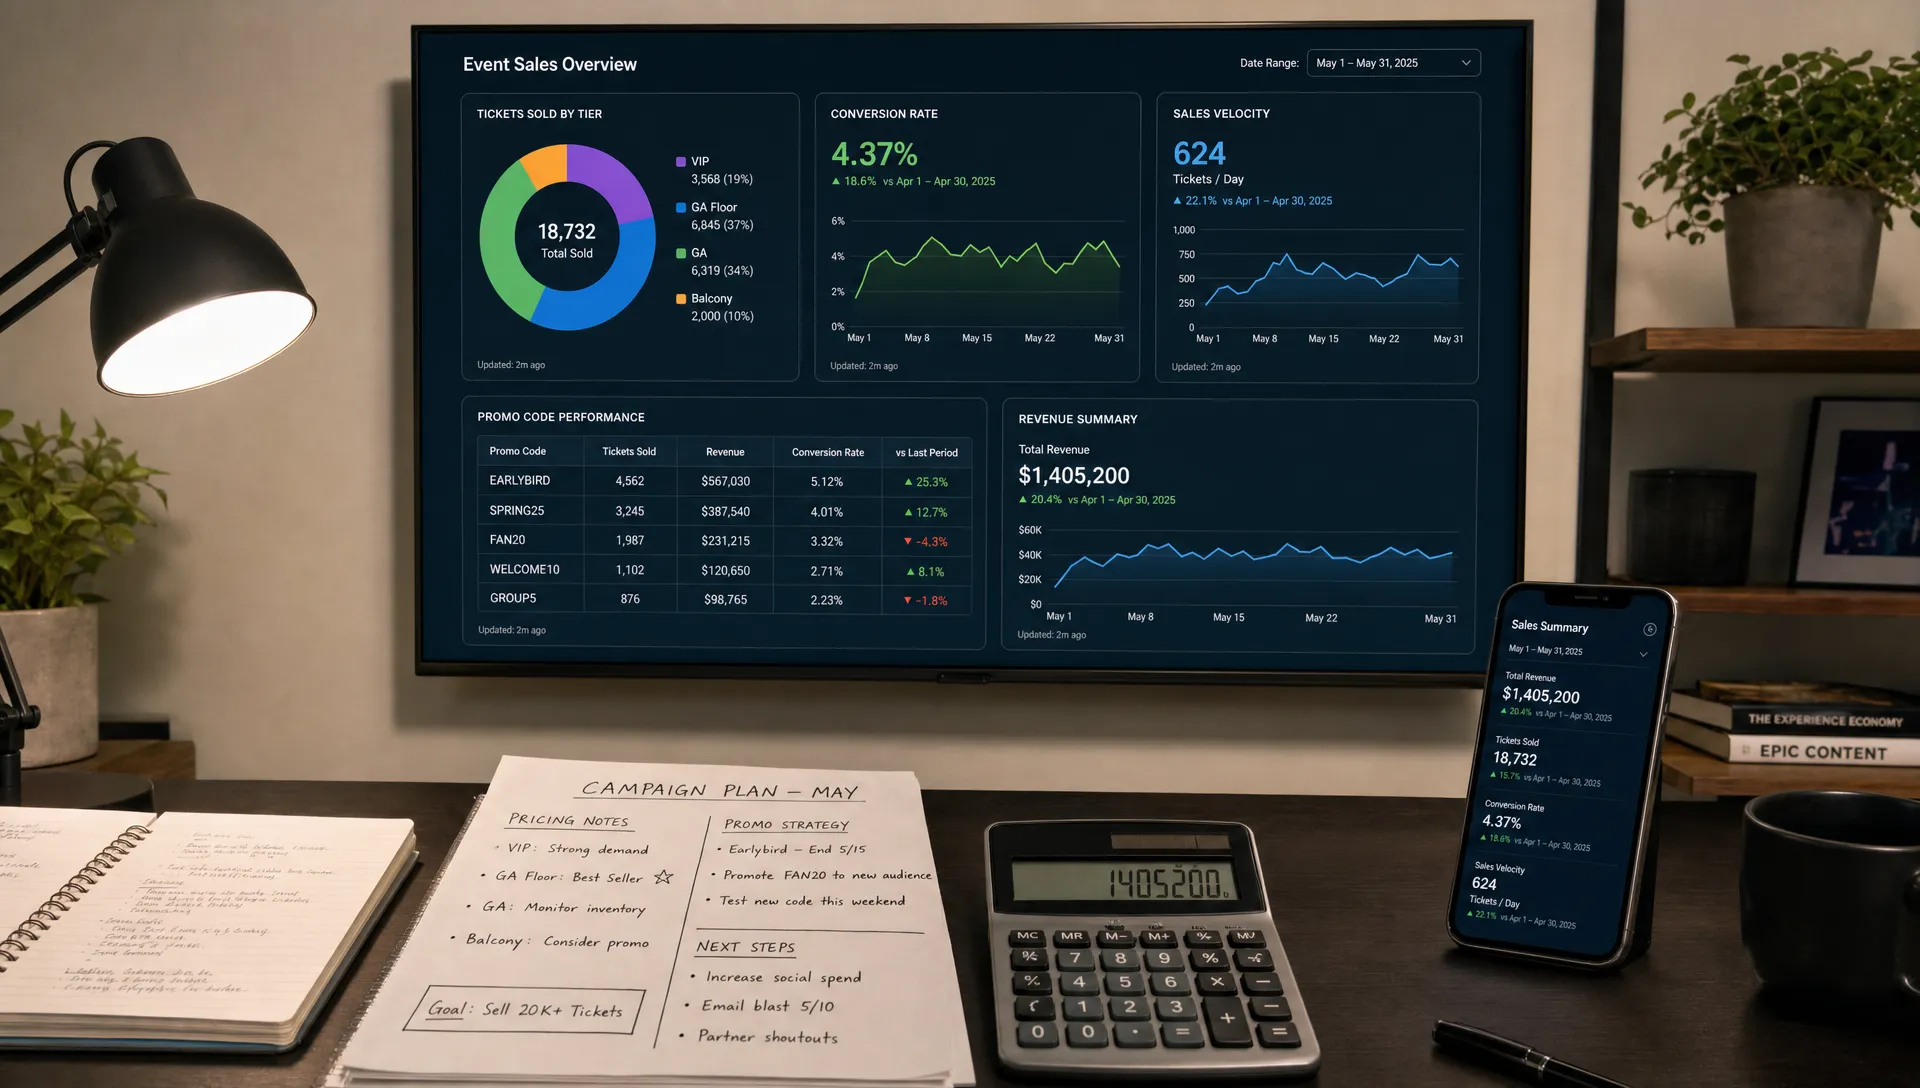
How to Use Ticket Statistics to Improve Event Sales
Ticket sales rarely fail all at once. They usually leak momentum in small, measurable ways: a pricing tier that stays open too long, a checkout step that loses impatient buyers, a promo code that fills the room but destroys margin, or a late marketing push that arrives after your best audience has already made plans.
That is why ticket statistics matter. They turn event sales from guesswork into a live feedback loop. Instead of waiting until after the event to ask what happened, organizers can use data while there is still time to adjust pricing, messaging, promotion, and cash flow.
For music producers, club promoters, conference teams, community organizers, and anyone selling admission, the goal is not to stare at reports. The goal is to make better decisions faster.
What ticket statistics actually tell you
Ticket statistics are the numbers behind buyer behavior. They show how people respond to your event offer, how quickly demand is building, and how much revenue is likely to land before show day.
The most useful statistics usually fall into five categories:
- Sales volume, including total tickets sold and tickets sold by tier
- Sales velocity, meaning how fast tickets are selling over time
- Revenue quality, including gross revenue, net revenue, fees, discounts, and refunds
- Conversion performance, including page visits, checkout starts, completed orders, and abandoned carts
- Audience and channel data, including referral source, promo code usage, location, and buyer type
The magic is not in any single metric. It is in how the metrics connect. If page traffic is high but completed orders are low, you may have a conversion problem. If early bird tickets sell out quickly but standard tickets stall, you may have underpriced the launch phase or failed to build urgency after it ended. If a partner promo code drives many orders but a low average order value, you may need to rethink the offer.
A simple way to read ticket statistics is to ask: what is this number telling me to do next?
| Ticket statistic | What it can reveal | Sales action to consider |
|---|---|---|
| Tickets sold by tier | Which price points buyers accept | Adjust tiers, inventory, or phase timing |
| Sales velocity | Whether demand is accelerating or slowing | Increase promotion, extend a phase, or raise prices |
| Checkout completion rate | Whether buyers are converting smoothly | Reduce friction and simplify the buying path |
| Promo code usage | Which partners or offers drive orders | Shift budget toward high-margin channels |
| Net revenue per ticket | How much money you actually keep | Revisit fees, discounts, and pricing structure |
| Sales by date and time | When your audience is most responsive | Schedule announcements and ad pushes more precisely |
Start with a sales target, not a spreadsheet
Ticket statistics become much more useful when you compare them to a goal. Before launch, define the sales target that matters most for your event.
For some organizers, the target is a sold-out room. For others, it is a cash flow milestone, such as covering venue deposit, artist guarantee, staffing, insurance, or production costs by a specific date. For a producer running multiple shows, the target may be to generate enough advance sales to fund marketing for the next event.
A practical pre-sale target should include three numbers: total tickets you need to sell, net revenue you need to keep, and the date by which you need that revenue. This keeps your attention on money available to operate, not just the impressive-looking top-line sales number.
For example, selling 300 tickets is not the same as keeping enough revenue from 300 tickets. Discounts, absorbed fees, refunds, and payment timing all affect the amount you can use. If protecting margin is a priority, it helps to understand how organizers can sell tickets without cutting into revenue by reducing avoidable friction and fee leakage.
Once your target is clear, every ticket statistic has context. A slow Tuesday is not automatically a problem. It is only a problem if the event is falling behind the pace needed to reach the goal.
Track sales velocity before you change your price
Total tickets sold tells you where you are. Sales velocity tells you where you are going.
Sales velocity is the rate at which tickets are selling over a specific period. You can track it by hour, day, week, or campaign window. A small event might only need a daily view. A high-demand concert, festival drop, or limited-capacity release may need an hourly view during launch.
A basic formula is:
Sales velocity = tickets sold during a period ÷ length of that period
If you sell 80 tickets in the first 24 hours, your first-day velocity is 80 tickets per day. If you sell 20 tickets over the next four days, your velocity has dropped to five tickets per day. That drop is normal after launch excitement, but it should trigger a question: do you have a planned second wave of demand?
Sales velocity helps you decide whether to:
- Increase prices because demand is stronger than expected
- Add or promote a new ticket tier because demand is slowing
- Activate a partner, artist, sponsor, or community channel
- Send a reminder before a price increase or sales phase deadline
- Hold your price steady because buyers need more trust or information
For events with phased pricing, velocity is especially important. If an early bird tier sells out in minutes, you may have priced it too low or allocated too much demand to your cheapest inventory. If it barely moves, the issue may be weak awareness, weak urgency, or a mismatch between the audience and the event promise.
A good rule is to avoid changing prices based on emotion. Use velocity, sell-through, and net revenue together. Fast sales at poor margin may not be success. Slow sales at a strong average price may still be healthy if your marketing calendar is backloaded.
Use tier statistics to find your real demand curve
Ticket tiers are not just labels like early bird, general admission, VIP, or last call. They are a live test of willingness to pay.
When you analyze ticket statistics by tier, look beyond which tier sold the most. Ask how each tier behaved relative to time, audience, and margin. Did VIP sell early because the offer was compelling, or because the quantity was too limited? Did general admission stall after the first price increase, or did marketing activity simply pause at the same time? Did group tickets sell because buyers loved the bundle, or because the individual ticket price felt too high?
The most useful tier statistics include:
- Sell-through rate, which shows what percentage of a tier has sold
- Time to sell out, which reveals urgency and price sensitivity
- Average revenue per ticket, which shows the financial quality of orders
- Discount share, which shows how much of a tier depends on incentives
- Upgrade rate, which shows whether buyers choose higher-value options when the difference is clear
If your platform supports flexible pricing and multiple ticket tiers, you can use these signals to refine your structure before the next event. TixFlow, for example, supports unlimited ticket tiers and automated sales phases, which makes it easier to plan pricing around real buyer behavior instead of one flat price for everyone.
For a deeper look at timing and phase design, it is worth reviewing how to set ticket sale dates for maximum momentum, because the right tier is only effective if it opens and closes at the right moment.
Diagnose checkout friction with conversion statistics
Some event teams spend heavily on awareness but lose buyers at the final step. That is expensive, because the buyer has already shown intent. They clicked, read, considered the price, and started moving toward purchase.
Checkout statistics help you see where that intent disappears. The core pattern is simple: compare the number of people who visit the event page, begin checkout, and complete an order. If the drop-off is unusually high, your problem may not be the event itself. It may be the buying experience.
Common causes include forced account creation, surprise fees, unclear ticket descriptions, too many required fields, slow loading, limited payment options, or a checkout experience that feels disconnected from the event brand.
This is where platform choice affects revenue. A ticketing platform with no buyer registration, a customizable checkout experience, and clear pricing can reduce unnecessary friction. TixFlow is built around fast purchase flow, flat per-ticket fees, and real-time sales control, which are especially useful when buyers are making quick decisions from social links, artist posts, or last-minute reminders.
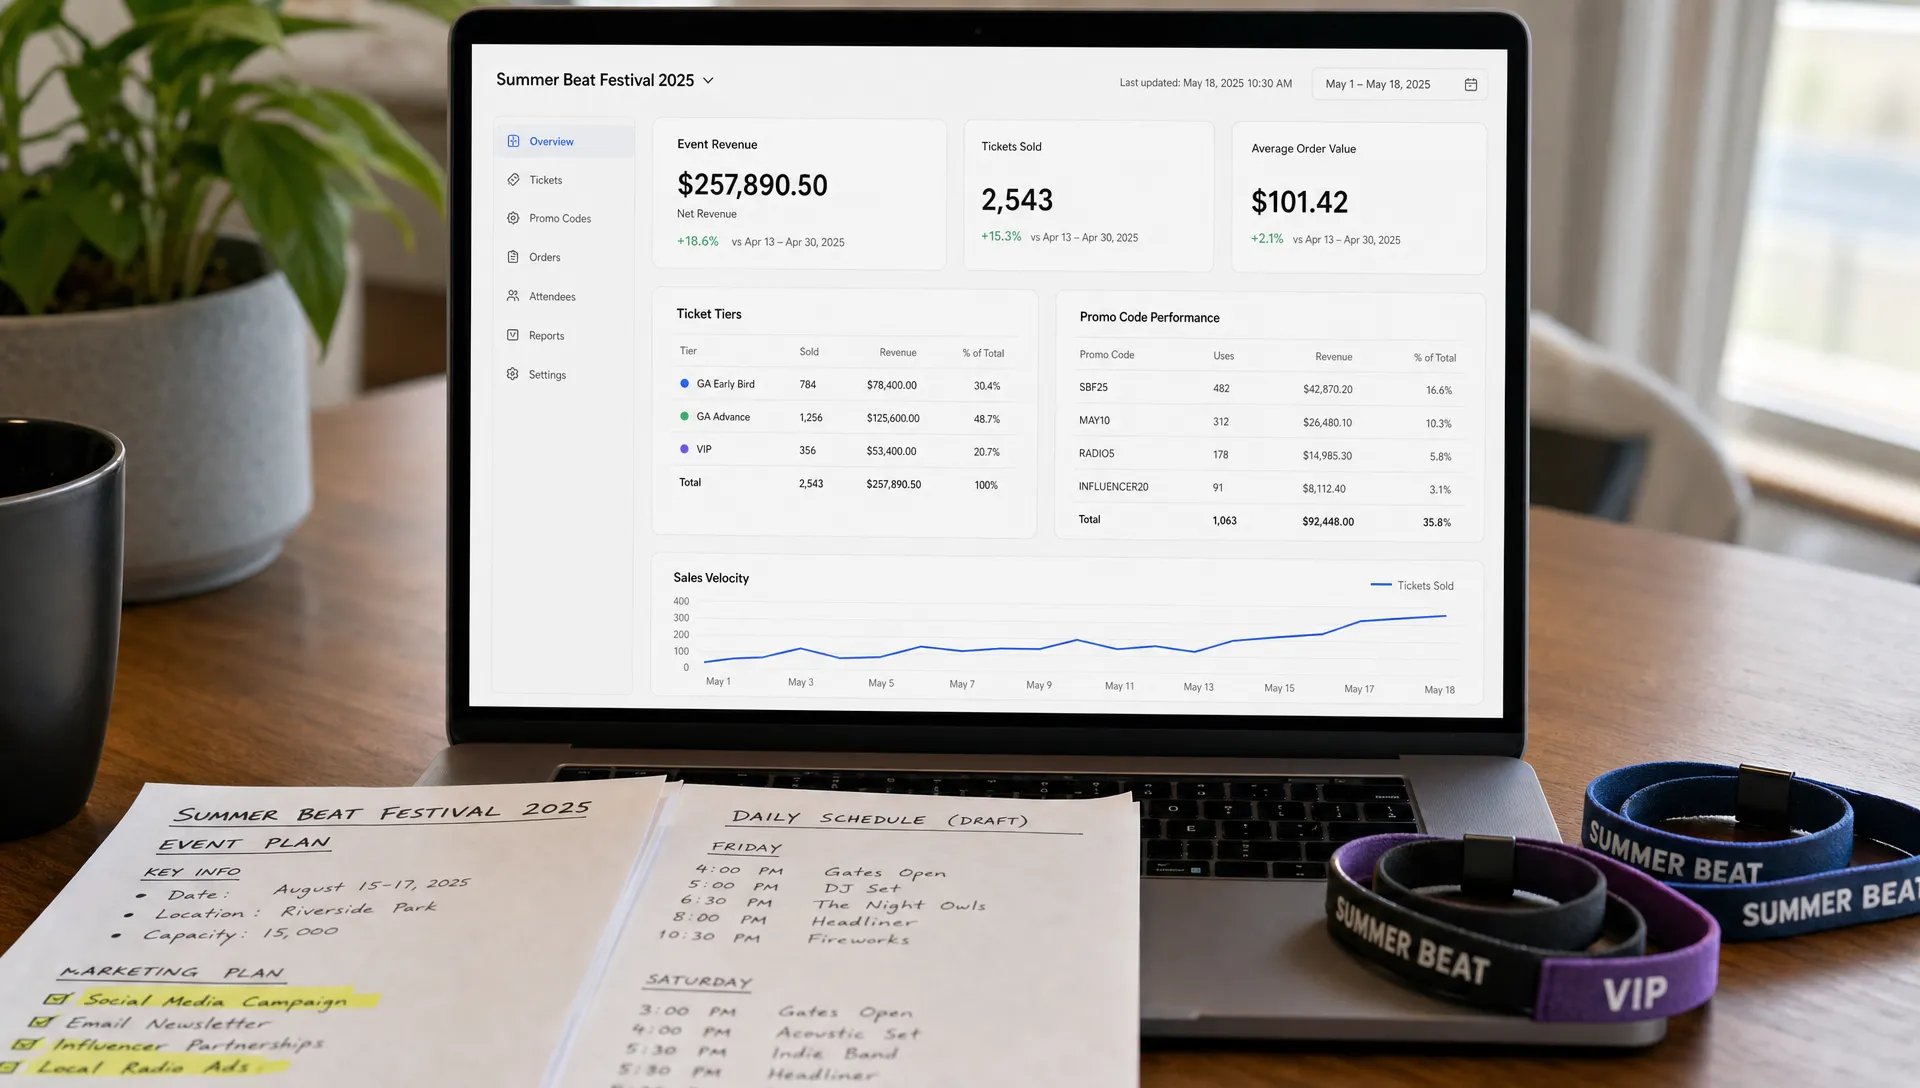
When reviewing checkout data, do not only ask whether people bought. Ask how easy it was for them to buy. The smoother the path, the less pressure you put on marketing to replace lost buyers.
Measure promo codes by profit, not vanity sales
Promo codes can be powerful, but they can also hide weak sales economics. A code that generates 100 orders may look like a win until you realize it only attracted buyers who would have purchased anyway, or it reduced net revenue below your target.
The best promo code statistics answer three questions: who drove the sale, what did the buyer pay, and did the order improve the event outcome?
For each code, track total orders, gross revenue, average order value, net revenue, redemption window, and buyer segment. A sponsor code used by new buyers may be more valuable than a broad public discount used by people already on your email list. A creator code may be worth keeping if it drives early volume and social proof. A deep discount may be worth cutting if it trains your audience to wait.
Smart promo codes are most useful when each code has a job. One code might reward loyal fans. Another might measure an artist partner. Another might unlock group sales. Another might support a limited flash push during a slow period. When every code has a purpose, the statistics are easier to interpret.
For music producers and rights holders, ticket statistics can also support decisions beyond the door. Demand by city, partner, artist, or fan segment can shape future bookings, sponsorship pitches, and licensing conversations. If your event activity connects to music IP, catalog value, or rights enforcement, an AI-powered IP monitoring and licensing platform can complement your ticket data by helping identify and monetize usage beyond ticket sales.
Compare marketing channels by buyer quality
Not all traffic is equal. A viral post can send thousands of visitors who never buy. A small email list can convert at a much higher rate because the audience already trusts the organizer. A venue partner may drive fewer clicks but larger group orders. Ticket statistics help you stop judging channels by attention alone.
Channel reporting should connect traffic source to completed orders and revenue. If possible, use tracking links, partner codes, or campaign-specific landing pages. At minimum, compare sales spikes against the timing of posts, emails, ads, artist announcements, and press mentions.
A useful channel comparison table looks like this:
| Channel | What to monitor | Strong signal | Weak signal |
|---|---|---|---|
| Email list | Opens, clicks, completed orders | High conversion and repeat buyers | Clicks without checkout starts |
| Artist or speaker post | Referral traffic and code use | Fast sales after announcement | Engagement without purchases |
| Paid ads | Cost per completed order | Predictable sales at acceptable cost | Traffic with low conversion |
| Venue or partner | Orders by referral or code | Group purchases and new buyers | Low usage after repeated pushes |
| Organic social | Sales spikes after posts | Direct response to urgency | Likes and shares without revenue |
The goal is not to abandon every low-converting channel. Some channels build awareness before buyers purchase elsewhere. But if a channel repeatedly produces traffic without orders, it needs a different message, a stronger offer, or less budget.
Use timing statistics to plan the next sales push
Event sales often move in waves. There is usually a launch spike, a mid-cycle slowdown, and a final surge as the date approaches. Ticket statistics help you decide when to push, not just what to push.
Look at the days and times when buyers complete orders. A professional conference may see stronger weekday sales during work hours. A nightlife event may convert better in the evening after social posts or artist announcements. A family event may sell more on weekends when groups can coordinate.
Timing statistics also help with price increases. If you announce a price jump too late, buyers may not have enough time to act. If you announce it too early, urgency fades. The best approach is to watch sales velocity and give buyers a clear reason to move now, such as a tier closing, limited inventory, lineup update, seating section change, or bonus ending.
This is where automated sales phases can protect your plan. Instead of manually watching the clock or changing prices under pressure, you can define phases in advance and let the sales structure support momentum.
Turn guest list data into operational decisions
Ticket statistics are not only for marketing. They also improve event operations.
Digital guest lists can show expected check-in volume, ticket type mix, comp usage, and arrival patterns. If VIP ticket holders are expected to arrive early, staffing and entry lanes should reflect that. If most buyers are general admission and purchased within the final 48 hours, you may need clearer pre-event communication and faster door validation. If group tickets are common, your entry team should know how to handle partial arrivals.
Sales data can also shape inventory, staffing, bar planning, merch, security, and artist settlement expectations. For organizers focused on cash flow, accurate advance sales reduce last-minute uncertainty. You can make commitments with more confidence because you know what has already been sold and paid.
Instant payouts can be especially valuable here. When ticket revenue reaches organizers quickly, sales statistics become more than a forecast. They become usable operating capital.
Build a weekly ticket statistics review habit
You do not need a complex analytics department to benefit from ticket statistics. A simple weekly review can catch most issues early enough to act.
During the main sales period, set a recurring time to review current sales against target. As the event gets closer, increase the frequency. For fast-moving events, daily checks during launch and final week may be necessary.
Focus each review on decisions, not decoration. A practical review should answer these questions:
- Are we ahead of, on pace with, or behind our ticket target?
- Which ticket tier is moving fastest, and which is lagging?
- Has sales velocity changed since the last campaign push?
- Are discounts improving net revenue or only increasing volume?
- Which channels are producing completed orders, not just clicks?
- Do we need to adjust pricing, messaging, timing, or partner activity?
Keep notes after each review. Over time, your event history becomes a planning advantage. You will know when your audience tends to buy, which tiers work, how much inventory to allocate to early pricing, and which marketing partners deserve priority.
Common mistakes when reading ticket statistics
The biggest mistake is treating ticket statistics as final judgment instead of live guidance. A slow start does not always mean your event is doomed. It may mean the audience needs clearer positioning, the price needs context, or the strongest announcement is still ahead.
Another mistake is celebrating gross sales without checking net revenue. High sales volume can still create cash flow problems if fees, discounts, refunds, or delayed payouts reduce usable money. For organizers who care about control, the quality and timing of revenue are as important as the number of tickets sold.
A third mistake is changing too many variables at once. If you lower the price, launch ads, add a speaker, send emails, and open a new tier on the same day, you may improve sales but learn very little. Whenever possible, isolate your changes so the statistics tell a clearer story.
Finally, avoid copying another event too closely. Your audience, venue, city, genre, price point, and purchase cycle all matter. Ticket statistics are valuable because they reflect your buyers, not a generic best practice.
Frequently Asked Questions
What are the most important ticket statistics to track? Start with tickets sold, sales velocity, revenue by tier, net revenue per ticket, checkout completion rate, promo code usage, and sales by channel. These numbers show whether demand, pricing, and conversion are working together.
How often should event organizers review ticket statistics? Weekly reviews work for most events during the main sales window. Review daily during launch week, after major announcements, near price increases, and during the final week before the event.
Can ticket statistics help if sales are already slow? Yes. Slow sales are easier to fix when you know where the slowdown is happening. If traffic is low, you may need more promotion. If traffic is high but purchases are low, the issue may be pricing, trust, or checkout friction.
How do ticket statistics improve cash flow? They help you predict revenue timing, identify which tiers generate usable income, and adjust sales phases before cash gets tight. Combined with fast payouts and clear fee structures, ticket statistics give organizers more control over event finances.
Should small events track ticket statistics too? Absolutely. Small events often have less room for error, so a few missed sales signals can matter. Even a simple weekly review of sales pace, revenue, and channel performance can improve decisions.
Make your next sales decision with better data
Ticket statistics are not just reports for after the event. They are signals you can use now to improve pricing, reduce checkout friction, protect margins, and plan smarter sales pushes.
With TixFlow, organizers can sell with flexible pricing, real-time sales control, instant payouts, smart promo codes, digital guest lists, flat per-ticket fees, and a checkout flow designed to reduce buyer friction. If you want a faster, cleaner way to turn demand into paid orders, explore TixFlow and build your next event around data you can act on.